How Trickle-Down Economics Hurt America
(ChatGPT)
Effects of trickle down economics: large wealth inequality, large national debt and deficits, wages stayed flat, cuts to social programs, shrinking middle class, loss of small businesses
What Is Trickle-Down Economics?
“Trickle-down economics” is the idea that if the government gives big tax cuts and benefits to rich people and large corporations, the money will “trickle down” to everyone else through jobs and investments. This idea became very popular in the 1980s, especially under President Ronald Reagan.
What Really Happened
Instead of making life better for most Americans, trickle-down policies often made problems worse:
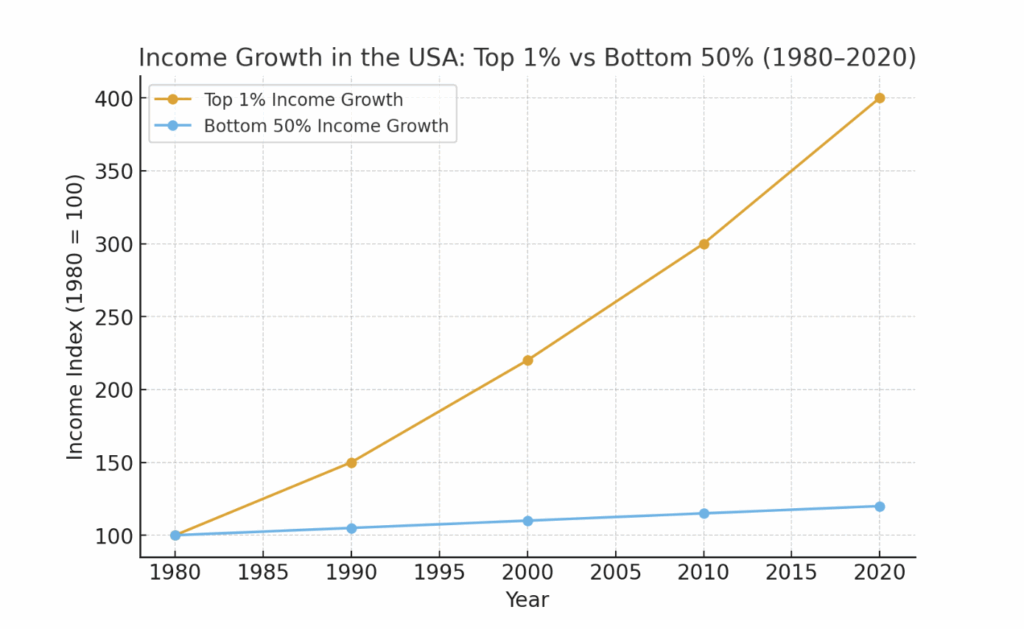
- More inequality – The rich got richer, but middle-class and poor families did not see the same growth in income. Wages stayed flat for many workers, even while costs of living went up.
- Less money for public services – Because taxes on the wealthy and corporations were cut, the government had less money to spend on schools, healthcare, and roads.
- Debt increased – The U.S. national debt grew quickly because the government was collecting less money in taxes but still spending on the military and other programs.
- Weaker communities – Local businesses often struggled because big corporations benefited more from tax breaks and could out-compete smaller stores.
The Result
After decades of trickle-down policies, America saw:
- The gap between rich and poor widen.
- The middle class shrink.
- Many families live paycheck to paycheck, even while billionaires grew wealthier than ever.
Even international organizations like the International Monetary Fund (IMF) found that giving more money to the top 20% does not help the economy grow, but supporting the poor and middle class does.
References:
- International Monetary Fund (IMF), Causes and Consequences of Income Inequality: A Global Perspective (2015): https://www.imf.org/external/pubs/ft/sdn/2015/sdn1513.pdf
- Economic Policy Institute, Trickle-Down Economics and Broken Promises: https://www.epi.org/publication/trickle-down-economics/
- Inequality.org, The Failure of Trickle-Down Economics: https://inequality.org/facts/trickle-down-economics/
- World Inequality Database: https://wid.world
Timeline: Trickle-Down Economics in the USA
1980s – The Reagan Years
- 1981 – President Ronald Reagan passed big tax cuts for the rich and corporations.
- The idea was that if wealthy people had more money, they would invest in businesses, which would help everyone.
- What happened: The economy grew for a while, but inequality started to rise. Wages for most workers did not increase much.
Reference: Tax Foundation – Reagan Tax Cuts: https://taxfoundation.org/reagan-tax-cuts/
1990s – Mixed Results
- The economy boomed in the late 1990s, but much of the new wealth went to the top earners.
- Middle-class incomes grew a little, but not nearly as fast as the wealth of the richest Americans.
Reference: Economic Policy Institute – Wage Stagnation: https://www.epi.org/publication/charting-wage-stagnation/
2000s – The Bush Tax Cuts
- 2001 and 2003 – President George W. Bush passed another set of tax cuts, again giving the biggest benefits to the wealthy.
- What happened: The national debt grew, and inequality widened further. The 2008 financial crisis hurt millions of working families, while banks and corporations were bailed out.
Reference: Center on Budget and Policy Priorities – Bush Tax Cuts: https://www.cbpp.org/research/federal-tax/the-bush-tax-cuts-costly-and-ineffective
2010s – The Recovery and More Inequality
- The economy recovered after 2008, but the gains mostly went to the top.
- Many workers saw flat wages while housing, healthcare, and education costs rose.
Reference: Pew Research – Middle Class Shrinking: https://www.pewresearch.org/social-trends/2020/01/09/trends-in-income-and-wealth-inequality/
2017 – The Trump Tax Cuts
- President Donald Trump signed the Tax Cuts and Jobs Act (2017), which lowered corporate taxes and gave more breaks to the wealthy.
- What happened: The rich and corporations got wealthier, stock buybacks grew, but the middle class and poor saw little long-term benefit.
Reference: Brookings – 2017 Tax Cuts: https://www.brookings.edu/articles/the-tax-cuts-and-jobs-act-failed-to-deliver-promised-investment-boom/
Today – The Outcome
The rich saw huge gains in their wealth and most of the nation saw far less
- The U.S. now has one of the highest inequality levels among wealthy nations.
- Billionaires gained trillions during recent years, while many Americans struggle with rent, medical bills, and student debt.
References
- World Inequality Database (WID), United States Income Inequality Data: https://wid.world/country/usa/
- Economic Policy Institute, The New Gilded Age: Income inequality in the U.S. by state, metropolitan area, and county: https://www.epi.org/publication/the-new-gilded-age-income-inequality-in-the-u-s-by-state-metropolitan-area-and-county/
- Thomas Piketty, Emmanuel Saez, and Gabriel Zucman (2018), Distributional National Accounts: https://gabriel-zucman.eu/usdina/
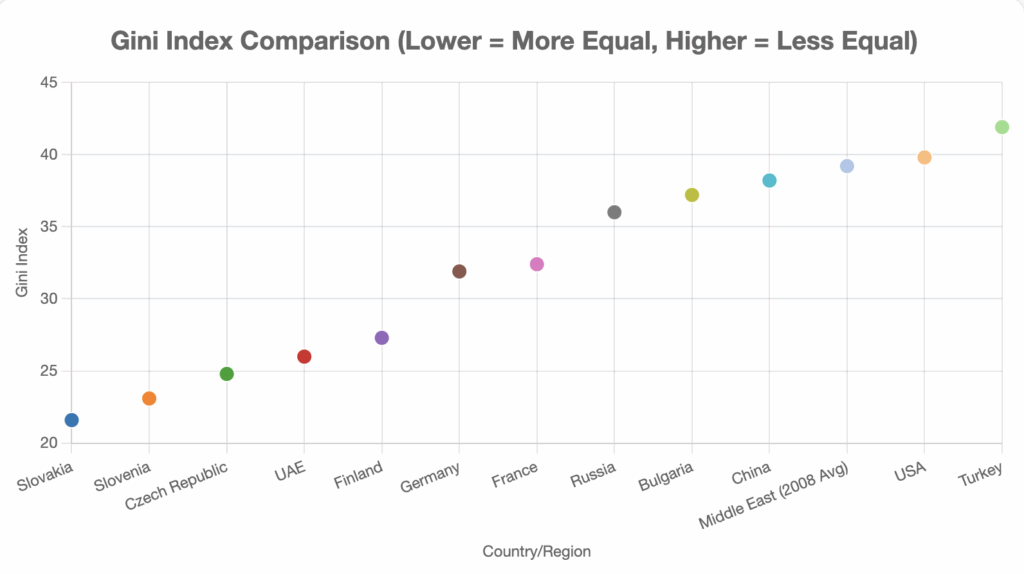
The Gini Index is the standard measure on inequality for a nation or a region. It ranges from 0 – everyone has the same amount. To 1 – one person has all the wealth.
Graph shows income inequality. Wealth inequality is much worse, around .85

References
- U.S. Census Bureau, Income Inequality in the U.S. 1947–2022: https://www.census.gov/library/visualizations/time-series/demo/gini-index.html
- World Bank, Gini Index (United States): https://data.worldbank.org/indicator/SI.POV.GINI?locations=US
Gini Index (income inquality) of other major nations
References
- World Bank. (2020). Gini index – United States. Retrieved from https://data.worldbank.org/indicator/SI.POV.GINI?locations=US
- Eurostat. (2024, July 18). Gini coefficient for equivalized disposable income in the European Union in 2023, by member state. Retrieved from https://www.statista.com/statistics/874070/gini-index-score-of-eu-countries/
- World Bank. (2023, July 25). Gini index in G20 countries in 2022. Retrieved from https://www.statista.com/statistics/1412911/gini-index-g20/
- Data Pandas. (2025, May 23). Gini Coefficient By Country 2025. Retrieved from https://www.datapandas.org/ranking/gini-coefficient-by-country
- UNICEF. (2008). Cited in Wikipedia: List of countries by income inequality. Retrieved from https://en.wikipedia.org/wiki/List_of_countries_by_income_inequality
- World Inequality Database. (2017). Data notes on China. Retrieved from https://wid.world/data/
Back to Game Plan email