How They Got So Much Wealth
By 1960 the wealth distribution had improved a lot. The American dream was widely accesible. The Nation did amazing things and the middle class was strong.
Gini Coefficient of wealth distribution:
- It’s 0 if everyone has the same amount
- It’s 1 if one person has all the wealth
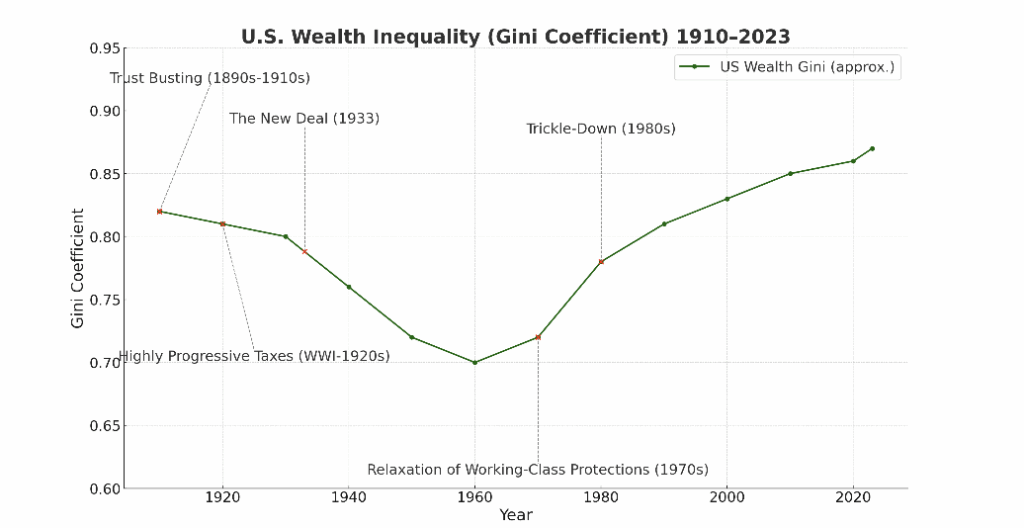
(Chart – ChatGPT)
The rich got richer and everyone else got left behind
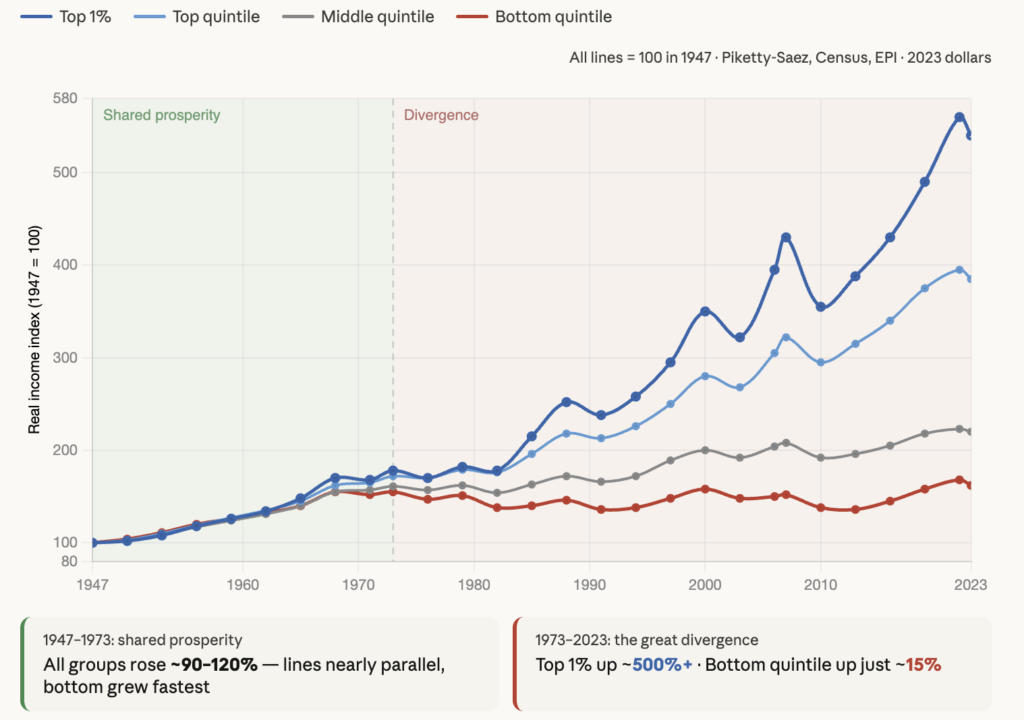
(Chart – Claude)
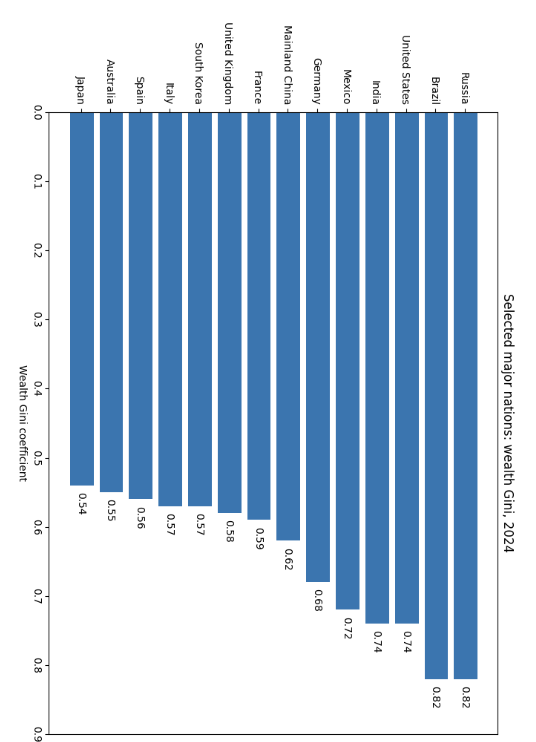
I used the 2024 wealth Gini coefficients reported in the UBS Global Wealth Report 2025. In that ranking, among these selected major countries, Japan is lowest at 0.54, while Brazil and Russia are highest at 0.82; the United States and India are both at 0.74. UBS notes that, in its 2024 sample, wealth Gini values range from 0.38 in Slovakia to 0.82 in Brazil, with higher values meaning greater wealth inequality. — ChatGPT
Back to We Can Sweep the Midterms
Back to “We Can Sweep the Midterms” email